EGTB market timing Signal Update — 02/27/2026
- Equality Regime
- Feb 28
- 3 min read
Equity Regime US Stock Market Top and Bottom Timing Signals

EGTB Signal — Feb 27, 2026
Bottom signal:
ACTIVE (Feb 12)
Top signal:
NONE
Timing classification:
Neutral compression
Regime:
Re-calibration within structural advance
Signal summary:
Bottom intact. No top formation. Structure unchanged.
Founder’s Note — EGTB Signal Update (Feb 27, 2026)
The EGTB bottom signal triggered on Feb 12 remains active, with no top signal confirmed. Current price behavior continues to validate the classification of the market environment as re-calibration within an intact structural advance.
Market internals reflect redistribution rather than deterioration. Breadth measures remain constructive, with NAHL holding positive territory and NAMO oscillating near neutral, indicating that participation softness represents rotational digestion rather than structural weakening.
Defensive participation has expanded meaningfully, with BPStaple and BPUTIL approaching saturation levels. This development reflects volatility compression and earnings visibility preference rather than risk exit. Simultaneously, growth-sensitive cohorts including XLK and IGV exhibit early stabilization following recent dispersion, suggesting ongoing capital reallocation rather than leadership abandonment.
Liquidity conditions remain supportive. DIX stabilization within a neutral-positive range indicates the absence of persistent institutional distribution, consistent with the interpretation of liquidity normalization rather than withdrawal.
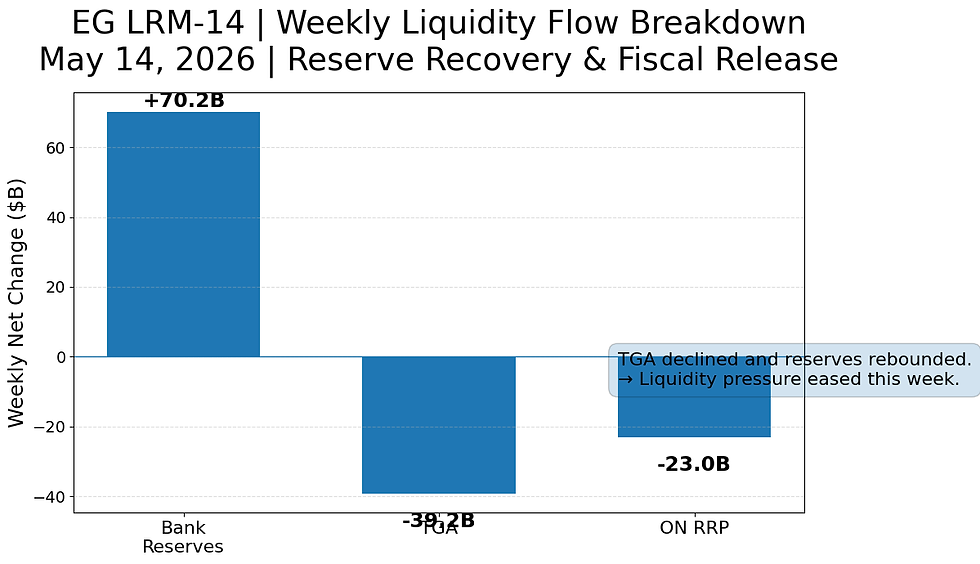
The EGLRM-14 liquidity framework further reinforces this assessment. Cross-segment capital flow dynamics continue to reflect redistribution across defensive, cyclical, and growth cohorts without evidence of systemic liquidity contraction. The current configuration aligns with late consolidation mechanics rather than regime transition.
Volatility architecture remains contained. Hedging demand has increased modestly, yet convexity pricing and term structure behavior do not indicate tail-risk repricing. Within the Equity Regime volatility framework, the Water-Drop signal has not been triggered, and therefore no structural reset condition is present.
Model validation remains intact. The structural pathway projected on Feb 1, 2026, continues to align with realized price evolution, including range formation, absorption dynamics, and stabilization behavior. This alignment reflects the system’s structure-first diagnostic design, emphasizing participation, liquidity architecture, and volatility topology over price extrapolation.

Conclusion
The EGTB framework continues to classify current conditions as re-calibration within an ongoing structural advance.
The Feb 12 bottom signal remains active.
No evidence of top formation has emerged.
Defensive breadth saturation reflects compression, not fear.
Growth participation stabilization supports rotational continuity.
EGLRM-14 liquidity dynamics confirm redistribution rather than contraction.
The Equity Regime Water-Drop signal remains untriggered.
The projected QQQ structural pathway remains validated and unchanged.
Addendum — Feb 28, 2026 (Added After Overnight Headlines)
Overnight on Feb 27, headlines reported U.S./Israel strikes on Iran. Concerns around potential disruption near the Strait of Hormuz triggered a broad risk-off tone into Monday’s open, with elevated upside gap risk in energy and downside gap risk in equities.
Because U.S. cash equities were not yet open, the immediate liquidation was concentrated in 24/7 markets — particularly BTC — which sold off on the headlines and then rebounded into a hammer-type daily structure.
This addendum is added today specifically due to the overnight escalation headlines. Our baseline view remains unchanged: short-term geopolitical shocks can drive temporary repricing and volatility, but historically they have not been the primary determinant of market direction. For reference, since 2000, major conflicts and U.S. equity reactions are listed below.
September 11 Attacks — Sept 11, 2001Fell ~11% in first week; recovered within one month.
War in Afghanistan — Oct 7, 2001Rose ~10% over the next three months.
Iraq War — Mar 20, 2003Strong rally over the next six months.
Russia–Georgia War — Aug 8, 2008Continued sharp decline (amid financial crisis).
Libyan War — Mar 19, 2011Brief pullback; uptrend resumed.
Crimea Crisis — Feb 20, 2014S&P 500 made new highs within one month.
Russia–Ukraine War — Feb 24, 2022Intraday reversal; later entered bear market.
Israel–Hamas Conflict — Oct 7, 2023Two weeks of volatility; macro trend resumed.

Rotation persists.
Leadership redistributes
.Structure remains intact.
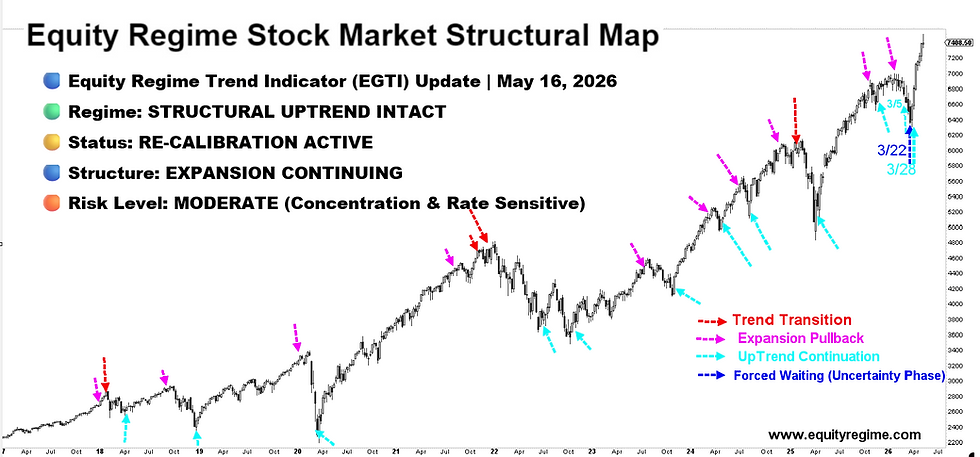
EGTB is a daily timing framework rather than a trend model and should be interpreted in conjunction with the Thursday EGTI trend signal for regime alignment.
This note reflects model-based market structure analysis and is intended for research context only.