EGTB Signal Update — Mar 25 2026
- Jenny LEE
- Mar 25
- 3 min read

Equity Regime US Stock Market Top and Bottom Timing Signals
This update reflects the current stock market outlook based on volatility structure, liquidity conditions, and market positioning.

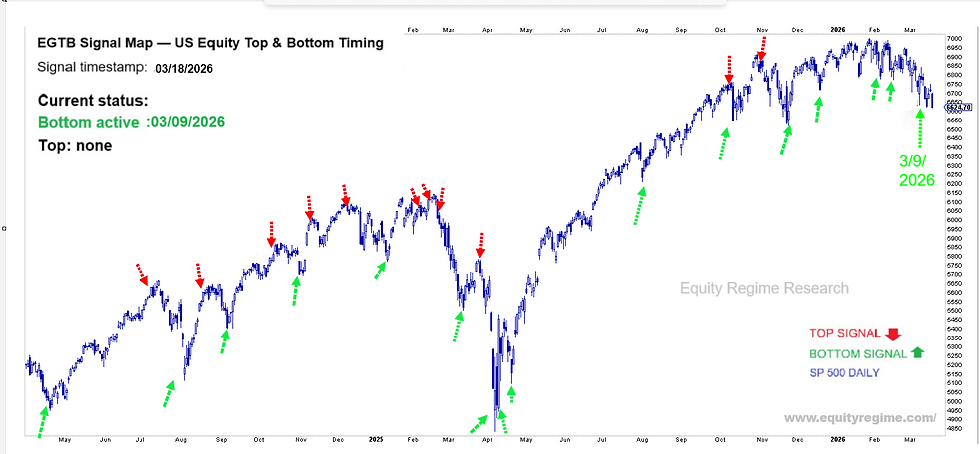
🟦 Equity Regime — US Equity Top & Bottom Timing
🟢Bottom: ACTIVE (Mar 9) | Forced Waiting
🔴 Top: NONE
🟡 Volatility compression: DEVELOPING
⚪ Credit stabilization: HOLDING
Signal Context
No new signal.
Recent price action remains within the expected timing window defined by the Mar 9 signal.
The market has transitioned from volatility exhaustion into a compression phase, consistent with the forced waiting environment defined in the latest EGTI update.
Across indices, the bottoming process remains non-synchronous:
– $QQQ has tested and stabilized near its 200MA– $SPX / $DIA / $IWM have approached or completed their downside targets
Follow-through remains uneven.
Model Notes
EGTB defines a timing window, and it's a leading indicator not a single-point reversal.
Volatility has shown signs of exhaustion, while risk and credit structures have not confirmed further downside acceleration.
Structure stabilizing. Follow-through pending.
EGTB = daily timing model Use with Thursday’s EGTI trend signal.
Founder’s Note — Mar 25
The current market is not lacking liquidity.
It is lacking clarity.
1. Flow Structure — ETF Dominance and Instability
The first driver of the current regime is how flows are entering the market.
ETF activity has risen to ~37% of total tape — near historical highs.
This matters structurally:
ETFs are non-discretionary flow vehicles
They allocate without price sensitivity
They amplify index-level movement, not stock-level stability
The higher the ETF share, the more the market behaves as a single system.
This creates a key condition:
Liquidity is present, but it is mechanically distributed — not selectively allocated.
As a result:
Price can move quickly
Correlation increases
Stability becomes conditional, not structural
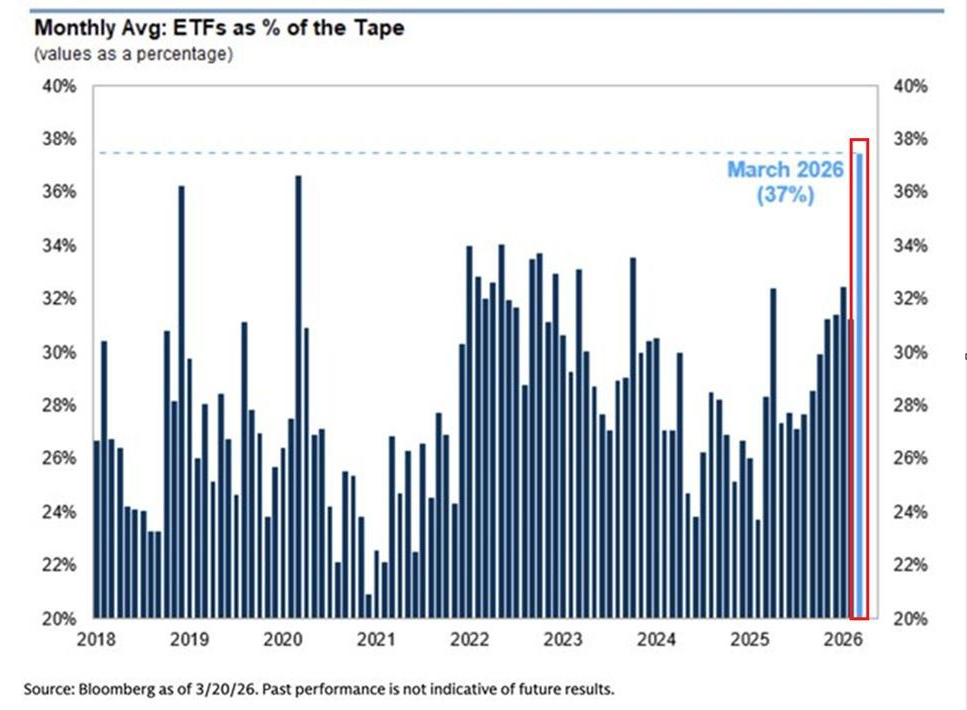
ETF trading share of total market volume reaching elevated levels indicating flow-driven market structure
2. Internal Structure — Uniform Weakness with Concentrated Stability

The sector map reveals the second layer of this regime.
Across sectors:
Most groups are in pullback or consolidation phases
There is no broad-based leadership expansion
Weakness is distributed, but orderly
However, one exception stands out:
Semiconductors ($SMH) remain structurally stable and in a sustained trend.
What this implies
This is not a balanced market. It is a concentrated stability regime.
Stability is not broad
It is anchored in a narrow leadership cluster
When combined with ETF-dominated flows:
ETFs support the index as a whole
But true strength is concentrated in a few components
👉 The result:
Index-level stability masking narrow internal leadership
Why this matters
As long as $SMH holds, the market can remain stable
But without broader confirmation,
→ there is no expansion
More importantly:
If leadership weakens, there is no secondary layer to absorb the shift
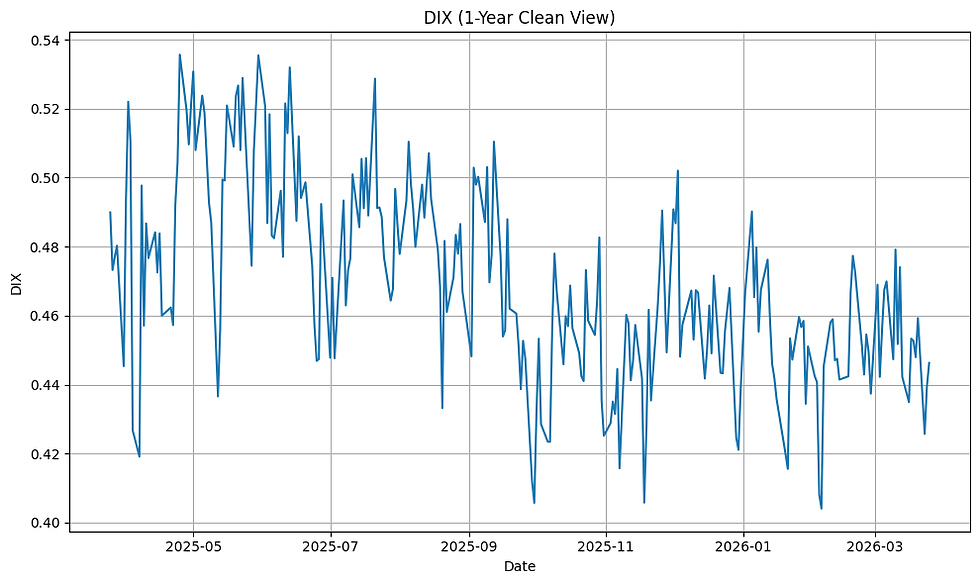
3. Structure — Gamma, Tail Risk, and Liquidity
The internal structure reinforces this “held, not driven” condition.
Gamma has turned positive → suppressing realized volatility
Tail-risk pricing (SDEX / TDEX / LTV) has declined → hedging reduced
DIX remains non-confirming → no strong accumulation signal
This combination creates:
Compressed surface, unconfirmed foundation
Implication
Stability is mechanically supported
But not structurally reinforced
And with hedging reduced:
The system becomes more sensitive to the next external trigger

4. Volatility Regime — Two-Sided Risk
This is not a directional setup. It is a two-sided volatility regime.
On the upside:
→ Reduced hedging can allow fast extension
On the downside:
→ Lack of protection can lead to fast repricing
Both tails are open.
5. Model Alignment — Forced Waiting Within an Intact Trend
This structure aligns precisely with the current model state:
EGTI: Structural uptrend intact
EGTB: Bottom active, but in forced waiting
Volatility: Compression after exhaustion
From a system perspective:
The Water Drop signal remains valid
There is no failure of the bottoming process
But there is no transition into expansion
Bottom confirmed. Follow-through delayed.
Conclusion
This is not a breakdown. This is not a breakout.
It is a forced waiting regime, where:
liquidity is stable
flows are mechanical
leadership is concentrated
and direction is externally conditioned
Final Line
The system is stable — but it is not anchored.
About Equity Regime
Equity Regime is an independent research platform dedicated to mapping structural shifts across markets, technology, and capital cycles.
Our focus is not on predicting daily price movements, but on identifying regime transitions — periods when consensus narratives lag underlying reality and long-term repricing quietly begins.
In an environment dominated by noise, our objective is simple:
Detect the shift before it becomes obvious.