EGTB Stock Market Bottom Signal Update — Apr 8 2026
- Jenny LEE
- Apr 8
- 3 min read

Equity Regime US Stock Market Top and Bottom Timing Signals. This update reflects the current stock market outlook based on volatility structure, liquidity conditions, and market positioning.
FIG 0 — EGTB Signal (Top & Bottom Timing Model)

EGTB Stock Market Bottom Signal — Expansion Phase
Bottom signal remains active since Mar 9 and has transitioned into early expansion.
Price is reclaiming prior structure, not stabilizing within a range. Volatility compression is advancing, and credit conditions remain stable.
No Top signal. Confirmation is in progress, not complete.
🟢 Bottom: ACTIVE (Mar 9) | Expansion Phase
🔴 Top: NONE
🟢 Volatility compression: ADVANCING
⚪ Credit stabilization: HOLDING / IMPROVING
Signal Context
The EGTB stock market bottom signal remains active.
What has changed is the state of structure.
The market has moved beyond stabilization and is now entering early-stage confirmation.
Recent price action is no longer confined to a bottoming range.
It reflects a reclaim of prior structure, not a reaction within it.
Volatility has transitioned from exhaustion into compression, and now into expansion following compression.
Cross-asset alignment remains incomplete, but is improving:
– $QQQ reclaiming structural mid-levels– $SPX / $DIA maintaining stability above support– $IWM lagging but no longer deteriorating
Follow-through is developing, not uniform.
This is alignment in progress, not completion.
Model Notes
EGTB defines a timing window, not a price-level confirmation.
Signals identify volatility exhaustion and potential inflection zones, but do not imply immediate trend reversal.
Stock market Bottom signals typically unfold through a multi-step process, with asynchronous confirmation across assets and structure.
Price confirmation, volatility compression, and cross-asset alignment may develop sequentially, not simultaneously.
EGTB should be used in conjunction with the EGTI trend framework to distinguish between stabilization and confirmed trend transition.
Founder’s Note : Stock Market Bottom Signal — Structure vs Completion
The bottom signal remains active, but the market’s behavior has shifted from stabilization toward early structural expansion.
What we are observing is no longer a bottoming process contained within a range, but a gradual realignment of price, volatility, and positioning following the initial exhaustion phase.
The recent move should not be evaluated in isolation from the prior low, because anchoring to the bottom mechanically makes any recovery appear extended, even when the underlying structure has not yet completed its expansion.
From a positioning perspective, the relevant question is not whether exposure should be reduced or increased in aggregate, but how capital is being reallocated across assets as the structure evolves.
Following the EGTI confirmation of trend continuation, the market typically enters a phase in which deployment becomes more efficient, not because prices are low, but because the asymmetry between risk and structure begins to improve.
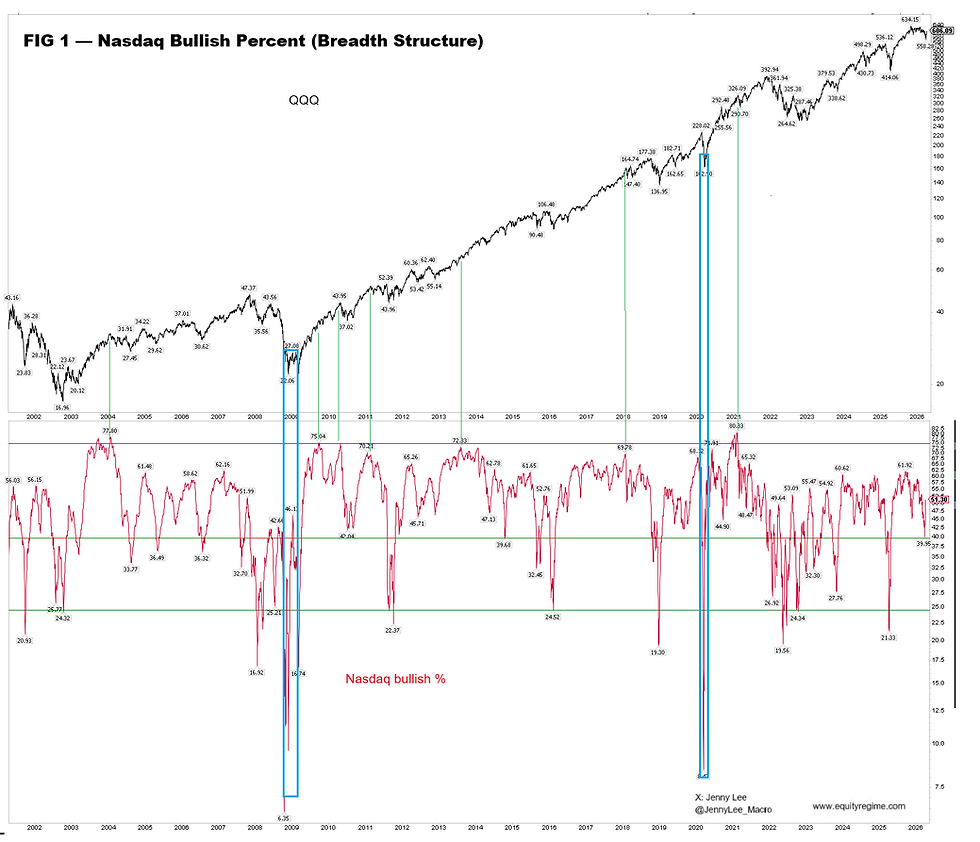
Breadth conditions further support this interpretation.
FIG 1 — Nasdaq Bullish Percent (Breadth Structure)Nasdaq Bullish Percent remains well below historical saturation levels, indicating incomplete participation and a market that is not yet fully deployed.
This suggests that the current advance is occurring within a rebuilding phase rather than a late-stage extension.
Alignment across the market remains partial and continues to develop.
FIG 2 — NAMO (Breadth Momentum / Internal Recovery)NAMO has recovered from deeply negative levels but has not reached extreme highs, indicating internal participation is improving but not yet saturated.
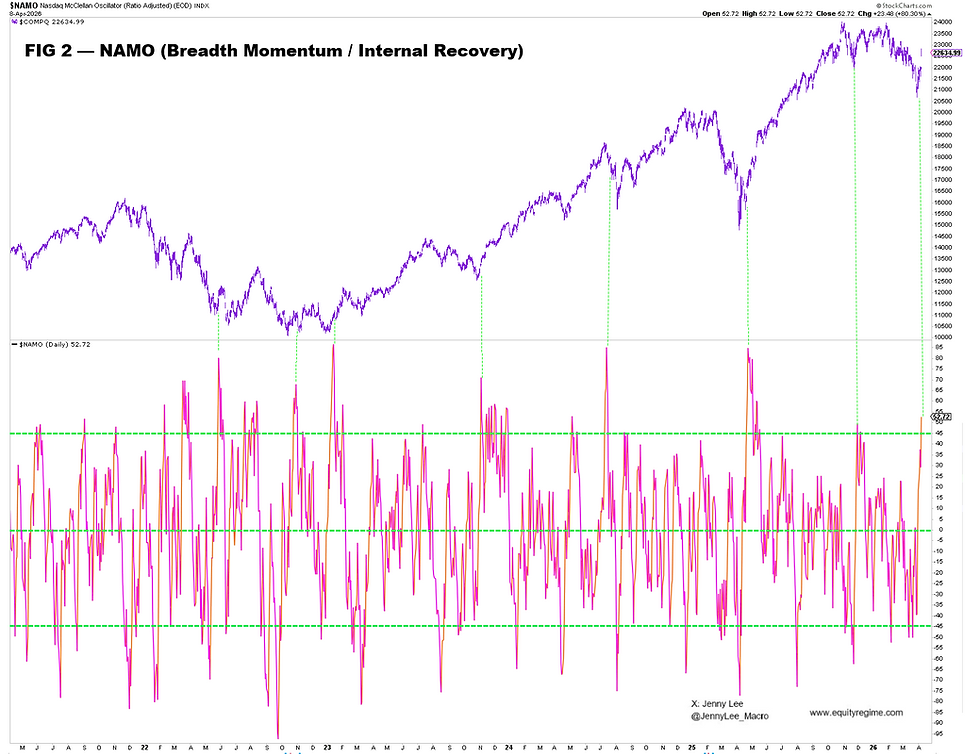
Under these conditions, price movement alone is not sufficient to define completion; what matters is whether the broader structure has fully expanded and synchronized across assets.
Conclusion:
While prices have advanced from the lows, the underlying structure remains in the process of development and has not yet reached completion.
About Equity Regime
Equity Regime is an independent research platform dedicated to mapping structural shifts across markets, technology, and capital cycles.
Our focus is not on predicting daily price movements, but on identifying regime transitions — periods when consensus narratives lag underlying reality and long-term repricing quietly begins.
In an environment dominated by noise, our objective is simple:
Detect the shift before it becomes obvious.


