Equity Regime Stock Market Monthly Report —April,2026
- Jenny LEE
- Apr 4
- 5 min read

Liquidity Dominance, Volatility Compression, and Conditional Market Sensitivity

Markets are not undergoing a structural breakdown, but they are no longer operating within the same liquidity conditions that defined the prior phase. What has changed is not the presence of liquidity, but the system’s ability to absorb shocks passively. The environment has transitioned from one defined by redistribution to one increasingly governed by direct sensitivity.
1. Stock Market Liquidity: From Redistribution to Adequacy Test
FIG 1 — US Liquidity Regime: End of Redistribution Mechanism

The stock market liquidity regime has shifted.
In earlier phases, the decline in ON RRP functioned as a redistribution mechanism, supporting bank reserves and stabilizing stock market liquidity conditions. Funds moved from the reverse repo facility back into the system, allowing markets to absorb tightening pressures without immediate stress.
That mechanism has largely run its course.
With ON RRP near exhaustion, stock market liquidity is no longer supported by internal redistribution.
The redistribution phase has ended. The system is now entering a bank reserve adequacy test.
The earlier phase of the cycle was supported by the drawdown of ON RRP, which functioned as a stabilizing transfer mechanism. Liquidity leaving the reverse repo facility re-entered the banking system through reserves, allowing markets to absorb tightening pressures without immediate stress.
That mechanism has largely run its course.
With ON RRP near exhaustion, the system no longer benefits from meaningful internal redistribution. What remains is a system dependent on the level and stability of reserves.
Liquidity is now the dominant variable. Oil defines the shock, volatility expresses the response, and credit confirms the outcome — but liquidity determines whether the system can absorb it.
2. Energy and Stock Market Liquidity Sensitivity
The recent increase in oil prices reflects a supply-driven repricing of risk rather than a demand-driven contraction.
This introduces cost pressure into stock market liquidity conditions and increases system sensitivity.
FIG 2 — Oil Price: Repricing Under Supply Risk

Energy is being repriced — not collapsing demand.
The recent increase in oil prices reflects a supply-driven repricing of risk rather than a demand-driven contraction. This introduces cost pressure and raises uncertainty, but does not independently define the regime.
The key question is not whether oil has moved, but whether the move has already been absorbed into expectations. Until that is resolved, energy remains a catalyst that amplifies system sensitivity rather than a determinant of structural outcome.
3. Volatility and Stock Market Liquidity Conditions
Volatility has increased, but stock market liquidity conditions remain structurally intact.
VIX remains within a long-term compression regime, indicating that stock market liquidity has not yet transitioned into a stress-driven volatility expansion.
FIG 3 — VIX (Monthly): Compression Regime at Upper Boundary

Compression remains intact. Expansion is not confirmed.
Although volatility has increased, the monthly structure remains within a long-term declining channel. VIX is positioned near the upper boundary of compression, but has not transitioned into a sustained expansion regime.
This positioning is critical.
It aligns with price structure and indicates that the system has not yet entered a phase of active risk release. Instead, volatility reflects increased sensitivity within a still-contained regime.
4. Credit as a Confirmation of Stock Market Liquidity Stability
Credit markets remain aligned with equities.
There is no divergence indicating stress in stock market liquidity conditions.
FIG 4 — Credit Markets: HYG / JNK vs SPY
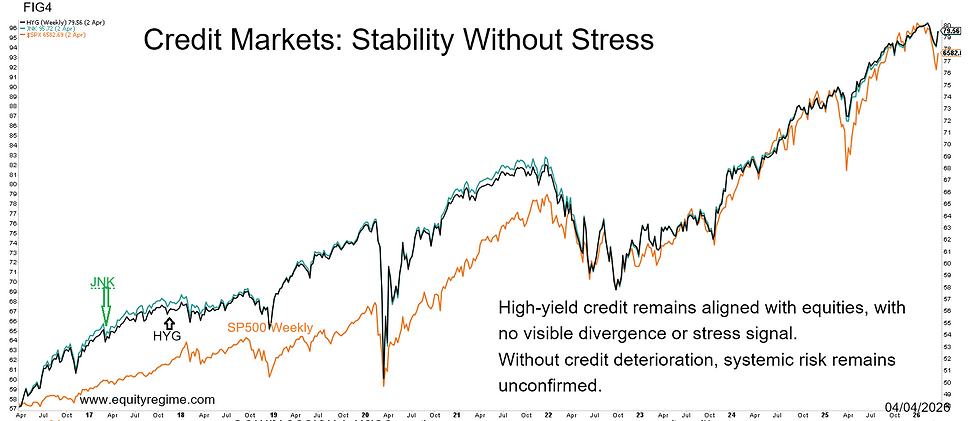
Credit remains stable. No systemic stress signal.
High-yield credit continues to move in alignment with equities, without divergence that would indicate structural deterioration. In prior cycles, credit has been the earliest confirmation layer of systemic stress.
That confirmation is absent.
Without credit deterioration, volatility alone is insufficient to define a breakdown.
5. Stock Market Liquidity and Price Structure
SPY remains within its long-term rising channel.
Current price action reflects a pullback within trend, interacting with the Bollinger midline as a key structural level.
FIG 5 — SPY: Uptrend Channel Under Test

Structure holds. Price is testing, not breaking.
Equity markets remain within a long-term rising channel. The recent rejection from the upper boundary has led to a pullback toward the Bollinger midline, representing a test within trend rather than a violation of structure.
This aligns directly with volatility positioning:
VIX at compression boundary
Price at structural boundary
Both indicate a system at a decision point, not a resolved direction.
6. April Flows and Stock Market Liquidity Timing
April introduces a critical variable through tax flows and potential liquidity re-injection. This is not theoretical; it is cyclical.
Historical precedent, including 2017, demonstrates that markets can advance under elevated macro uncertainty when liquidity conditions improve. At that time, trade tensions were present, yet equities moved higher as liquidity timing offset narrative risk.
The implication is not repetition, but hierarchy:
Liquidity timing can override macro narrative.
7. Stock Market Liquidity Framework and Conditions
The system is defined by a specific configuration:
Liquidity no longer expanding, but not yet contracting
Volatility elevated, but structurally contained
Credit stable
Price testing within trend
This produces a regime of conditional stability under rising sensitivity.
The system is no longer buffered — but it is not yet under stress.
Framework (Boundary Conditions, Not Prediction)
The framework breaks only under a specific condition:
A sustained energy shock combined with declining reserves and confirmed deterioration in credit.
Without all three, the system remains sensitive — but stable.
Conclusion
Markets are not trending. They are resolving.
Liquidity has shifted from expansion to adequacy.
Volatility has risen but not expanded structurally.
Credit continues to confirm stability.
Price is testing structure, not breaking it.
The system is no longer buffered — but it is not yet under stress.
About Equity Regime
Equity Regime is an independent research platform dedicated to mapping structural shifts across markets, technology, and capital cycles.
Our focus is not on predicting daily price movements, but on identifying regime transitions — periods when consensus narratives lag underlying reality and long-term repricing quietly begins.
In an environment dominated by noise, our objective is simple:
Detect the shift before it becomes obvious.


