NVIDIA Corp (NVDA) — Structural Re-Acceleration? Stock Structure Radar | May 2026

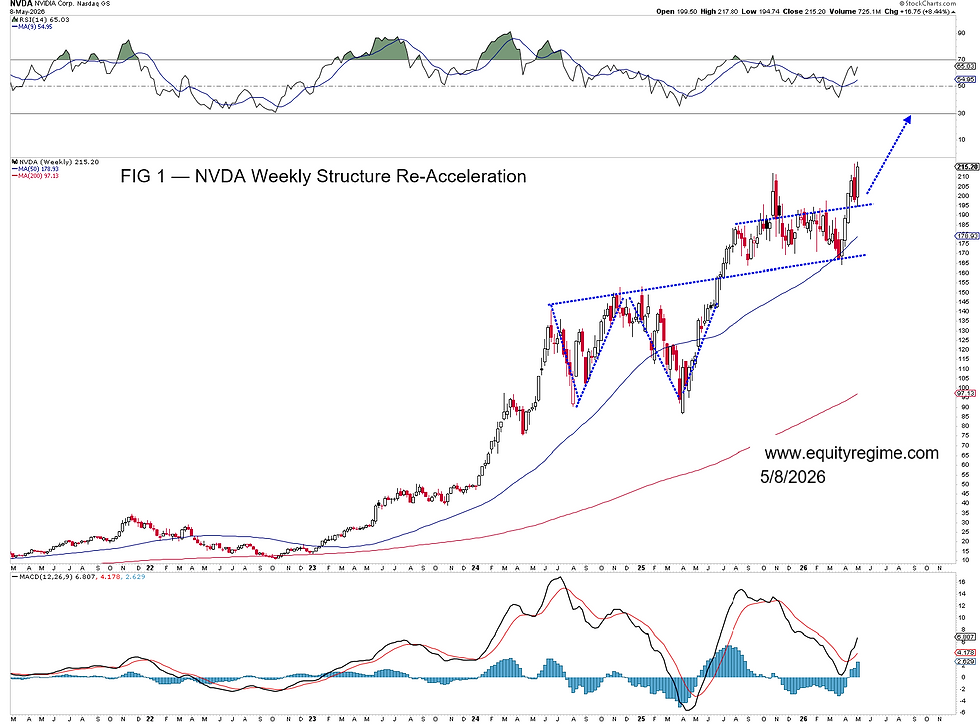
NVIDIA Corp (NVDA) STOCK PRICE continues to display one of the strongest large-cap weekly structures in the market.
The current setup increasingly resembles:
high-level re-accumulation,
momentum reset,
and trend re-acceleration.
Key structural observations:
Weekly MACD has turned upward into a fresh bullish crossover.
RSI remains in a long-term uptrend without reaching historical extreme levels.
Price continues to hold above the rising 50-week moving average.
Multi-month consolidation appears orderly rather than distributive.
At the current stage, the weekly structure does not yet resemble a confirmed long-term exhaustion pattern.
If the current weekly structure continues to hold and momentum expansion persists, the broader technical projection increasingly points toward the $270–290 region as a potential long-term expansion zone.
NVIDIA Corp (NVDA) Fundamental Structure
NVDA is no longer trading solely as a semiconductor company.
It increasingly functions as the core infrastructure layer of the global AI capital expenditure cycle.
Key structural drivers include:
hyperscaler AI spending,
sovereign AI initiatives,
inference scaling demand,
networking and memory ecosystem dependency,
and continued AI data center expansion.
Importantly, market positioning toward AI infrastructure remains concentrated rather than broadly saturated. Capital continues to treat NVDA as a primary AI exposure vehicle rather than a mature cyclical semiconductor name.
NVIDIA Corp (NVDA) STOCK Positioning, Sentiment & Gamma Structure
Despite NVDA’s massive market capitalization, current positioning conditions do not yet resemble a classic euphoric blow-off environment.
Options activity continues to heavily influence short-term price behavior:
persistent call demand,
dealer hedging flows,
and momentum-driven gamma dynamics remain supportive during upside expansions.
At the same time, institutional ownership concentration and passive index exposure create conditions where pullbacks may continue attracting systematic inflows.
This combination can produce a reflexive structure:
higher prices → increased benchmark pressure → additional capital inflows → further price expansion.
Historically, these conditions can persist far longer than traditional valuation frameworks would imply.
Stock Structure Radar Notes
Stock Structure Radar operates beneath the broader Equity Regime framework.
Primary market structure interpretation remains driven by:
EGTI (US Stock Market Trend Signal)
EGTB (Top & Bottom Timing Signal)
Supplementary tools include:
EGLRM-14 Liquidity Regime Monitoring
VIX Structural Monitoring
Positioning & Volatility Structure Analysis
This report reflects structural interpretation only and is not investment advice. Positions discussed may be held by the author.