Semiconductor Slopes and Market Regimes
- Jenny LEE
- Apr 25
- 7 min read

Acceleration, Danger Zones, and the Structure of Bull Markets
Introduction
Most market analysis revolves around valuation, liquidity, earnings revisions, sentiment, and technical indicators. Much less attention is given to another structural question: whether the slope of long-term price appreciation itself may contain information about the growth regime driving an asset.
This essay explores that possibility through semiconductor equities, using VanEck Semiconductor ETF (SMH) as a case study.
Its central argument is simple.
Not all steep advances are equivalent.
Markets may operate under different slope regimes, and distinguishing among those regimes may offer a more useful framework for thinking about acceleration, bubbles, corrections, and long-cycle market structure than treating all sharp advances as variations of the same phenomenon.
This is not intended as a conventional trendline exercise or a price forecast.
It is an attempt to interpret long-duration price slopes as a structural framework.
I. Why Semiconductors May Offer a Useful Structural Lens
Semiconductors occupy a distinctive place in financial markets because they are not simply another cyclical sector. Repeatedly, they have functioned as infrastructure for major technological expansions—from personal computing and internet buildout to cloud, mobile, and now artificial intelligence.
That matters because industries shaped by repeated technological diffusion may not be expected to grow along a constant long-term slope.
If the underlying growth function itself periodically accelerates, it should not be surprising if the market’s pricing of that growth also exhibits shifts in slope.
This possibility suggests that unusually steep price behavior may sometimes reflect repricing of higher long-duration growth expectations rather than speculative excess alone.
That distinction lies at the center of this framework.
II. A Slope-Regime Framework: From Reset to Super-Slope
Figure 1 — Slope-Regime Framework for Semiconductor Equities: Reset, Normal Slope, Accelerated Slope, and the Super-Slope Danger Zone
Figure 1 illustrates a conceptual slope-regime framework for interpreting long-term semiconductor equity behavior. The framework distinguishes five broad states: reset slope, normal structural slope, accelerated slope, a transitional danger zone, and super-slope behavior. It proposes that instability may arise not from steep slopes alone, but when accelerated growth migrates toward self-destabilizing super-slope conditions.

Notes:
(1) Slopes shown are conceptual representations of growth-regime states rather than mechanically fitted trendlines.
(2) “Danger Zone” refers to a potential instability threshold, not an automatic market top.
(3) Accelerated slope behavior may support continued upside but may also imply greater sensitivity to both positive and negative catalysts.
(4) The figure is intended as a regime-classification framework, not a price forecast.
A common weakness in long-term chart analysis is the tendency to treat all rising slopes as variations of a single secular trend.
Figure 1 suggests otherwise.
It may be more useful to distinguish among five broad slope states.
1. Reset Slope
Major dislocations may not simply interrupt an existing growth slope but reconstruct it.
Under this interpretation, episodes such as the post-2008 recovery can be viewed not merely as rebounds, but as slope resets from which new long-term growth trajectories emerge.
This is not correction.
It is regime reconstruction.
2. Normal Structural Slope
Following a reset, secular growth may proceed along a relatively stable structural slope.
This represents the long-duration compounding baseline of the industry.
It is the reference slope against which later accelerations may be evaluated.
3. Accelerated Slope
At times, technological diffusion may lift price behavior above its structural slope into an accelerated regime.
This need not imply instability.
It may reflect repricing associated with stronger growth expectations.
Acceleration is not automatically bubble behavior.
It may simply represent a higher-growth regime.
That may be how the present AI-driven semiconductor cycle should be interpreted.
4. The Danger Zone
Acceleration, however, may migrate toward a threshold where slope behavior begins becoming self-destabilizing.
That transition region is labeled here the danger zone.
It is not synonymous with a market top.
It is an instability threshold.
The argument of this framework is not that semiconductor prices cannot fall.
It is that they may not yet have entered this historical danger zone.
That is a different claim.
5. Super-Slope
Beyond that threshold lies a qualitatively different regime.
Not merely faster growth,
but near-parabolic super-slope behavior.
Historically, this type of slope has often been associated with terminal speculative phases.
The late-stage 1999–2000 episode may be interpreted as one example.
This may be fundamentally different from today’s accelerated slope behavior.
III. Why the Present May Resemble 1995 More Than 2000
Figure 2 — Super-Slope Excess Versus Accelerated Slope Regime
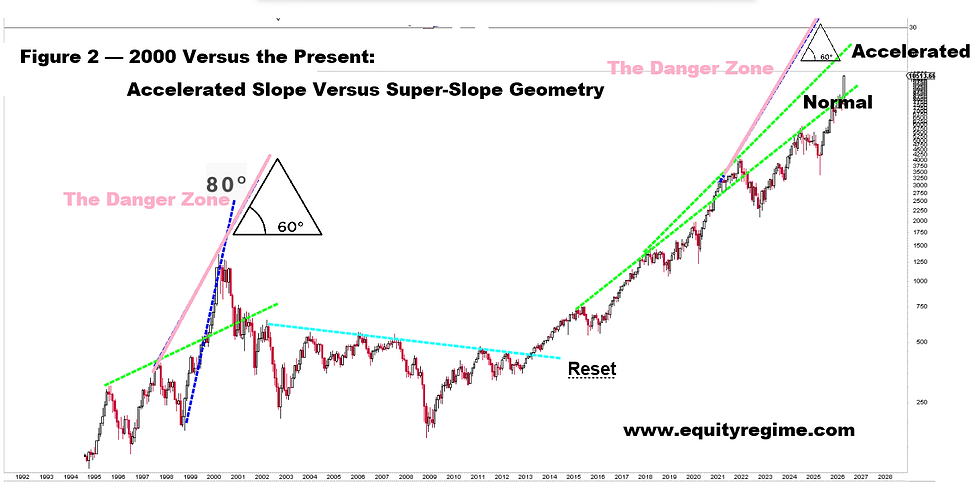
Figure 2 contrasts two distinct slope geometries. The 1999–2000 episode approached a near-80° super-slope condition associated with the danger zone, whereas the present appears closer to a materially lower accelerated slope nearer 60°. The distinction suggests that steep price appreciation alone does not imply the market occupies the same structural stage as 2000.
The distinction illustrated in Figure 2 may be more important than conventional valuation comparisons.
Much of the analogy between the present cycle and 2000 rests on the assumption that all steep advances are equivalent.
The figure suggests they may not be.
The late-1990s terminal advance appears closer to a near-parabolic super-slope condition, with price geometry approaching instability territory.
The current cycle, while operating above long-run structural slope, may still be better characterized as an accelerated slope regime.
That is not a trivial distinction.
It implies a different market stage.
This may be why the present could bear greater resemblance to 1995 than to 2000.
The argument is not that present conditions are risk-free.
It is that they may be structurally different from a terminal super-slope climax.
IV. Accelerated Slope Regimes Are Simultaneously Powerful and Sensitive
Moving into an accelerated slope regime does not reduce risk.
It may increase sensitivity.
Once prices rise materially above structural slope, markets may become more responsive to catalysts in both directions.
That asymmetry cuts both ways.
Positive developments—earnings upside, stronger capital spending expectations, favorable liquidity conditions, supportive economic sentiment—may generate upside responses greater than those seen under lower-slope regimes.
But disappointments may also be amplified.
This is not a low-risk state.
It is a high-convexity state.
Accelerated slope regimes may be simultaneously fragile and powerful.
That may be one of their defining characteristics.
V. Corrections Can Occur At Any Time; Structural Breaks Require Triggers
This framework does not claim semiconductor equities cannot decline.
Sharp corrections may occur at any time.
Indeed, once prices operate in accelerated regimes, downside sensitivity may increase.
However, large structural collapses typically require triggers.
Steep slopes alone do not mechanically generate collapse.
Triggers do.
Potential triggers may include:
material deterioration in growth expectations
disruption in the AI capital spending cycle
recessionary shocks
liquidity or credit accidents
migration from accelerated slope into unstable super-slope excess.
Absent such triggers, accelerated slope regimes may remain volatile, sensitive, and yet continue substantially higher.
This is not an argument against downside risk.
It is an argument that large structural declines generally require more than steep slopes alone.
VI. Broad Equity Indices May Behave Differently: Structural Slope With Periodic Reset
Figure 3 — Structural Slope Persistence and Reset in the S&P 500

Figure 3 illustrates a structural interpretation of the S&P 500 in which long-term market behavior may be understood not as uninterrupted trend growth, but as persistent structural slope periodically interrupted by reset phases.
While sectors such as semiconductors may exhibit repeated slope acceleration, broad indices may often behave through a different pattern:
a persistent structural slope periodically interrupted by reset phases.
This distinction may help explain why broad markets can absorb sector-specific acceleration without necessarily entering systemic super-slope instability.
The 2000–09 period may be interpreted not as permanent breakdown of secular growth, but as a prolonged reset during which prior excess was absorbed before structural slope reasserted itself.
This may be a different model of secular market behavior.
VII. Resets May Be Structural Features, Not Exceptions
Figure 4 — Long-Term Equity Markets as Structural Slope Interrupted by Periodic Resets

Figure 4 extends the slope-regime framework over nearly a century of S&P 500 history and suggests secular bull markets may be interpreted as persistent structural slope periodically interrupted by reset phases.
Figure 4 suggests a broader interpretation.
Major bear markets may not simply interrupt secular growth.
They may help define it.
Rather than treating episodes such as the 1930s, the 1970s, or 2000–09 as isolated breaks in a long-term trend, one may interpret them as recurring reset phases through which structural slope is periodically re-established.
That implies resets may not represent failure of secular growth.
They may be part of its operating structure.
If resets are structural features rather than anomalies, cyclical breakdowns need not automatically imply the end of long-term slope persistence.
VIII. Implications for the Current Cycle
The practical implication of this framework is not that risk is absent.
It is that the question may often be framed incorrectly.
The relevant question may not be:
Will semiconductors correct?
They almost certainly will.
The more important question may be:
What slope regime are they correcting within?
A correction occurring inside an accelerated slope regime may be fundamentally different from a breakdown emerging from a super-slope danger zone.
Further substantial upside and significant corrections are not mutually exclusive possibilities.
Both may remain consistent with the same accelerated regime.
What would alter that interpretation is not volatility alone,
but evidence of migration into instability geometry historically associated with super-slope behavior.
That may be where genuine structural concern begins.
Conclusion
The principal question raised by semiconductor price behavior may not be whether valuations are justified, nor whether corrections will occur.
Corrections are inevitable.
The more important question may be whether the market is operating within a normal slope regime, an accelerated slope regime, or a super-slope phase.
Those are not semantic distinctions.
They imply materially different interpretations of opportunity and risk.
If the present remains an accelerated slope regime rather than a super-slope climax, then comparisons to 2000 may be overstated.
In that case, semiconductor equities may be signaling not terminal excess, but a market still responding to a powerful technological expansion whose slope has not yet entered its historical danger zone.
That conclusion does not eliminate risk.
It suggests only that steepness alone may be insufficient reason to confuse acceleration with instability.
And that may be a distinction worth making
About Equity Regime
Equity Regime is an independent research platform dedicated to mapping structural shifts across markets, technology, and capital cycles.
Our focus is not on predicting daily price movements, but on identifying regime transitions — periods when consensus narratives lag underlying reality and long-term repricing quietly begins.
In an environment dominated by noise, our objective is simple:
Detect the shift before it becomes obvious.


