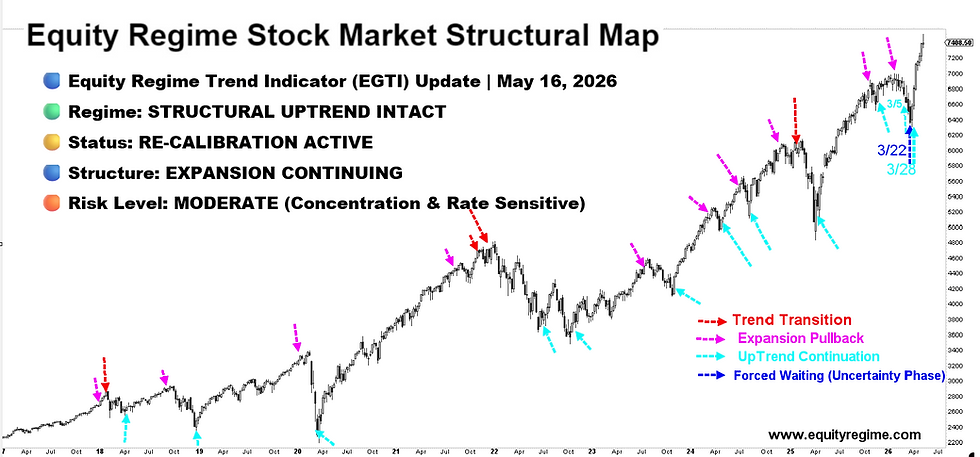
Stock Market Structure Continuation — EGTI Stock Market Weekly Trend Indicator Updated 04/19/2026
- Jenny LEE
- Apr 19
- 4 min read

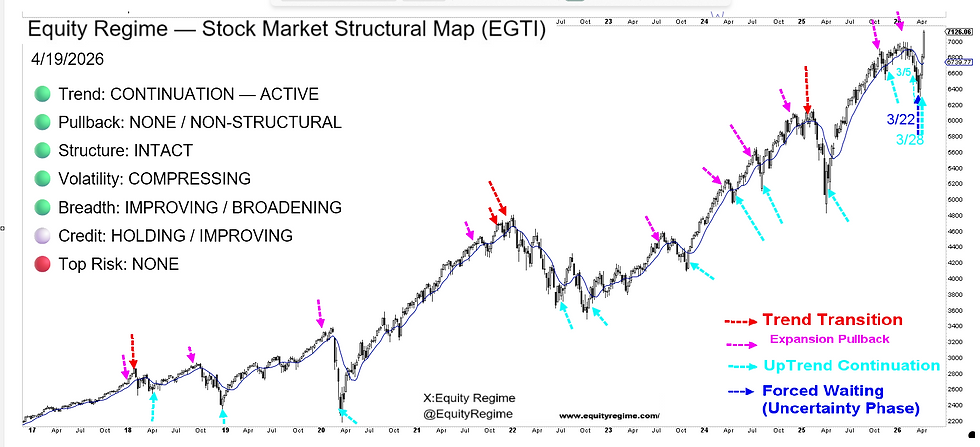
EGTI Stock Market Weekly Trend Indicator Updated 04/19/2026
🟢 Trend: CONTINUATION — ACTIVE
🟢 Pullback: NONE / NON-STRUCTURAL
🟢 Structure: INTACT
🟢 Volatility: COMPRESSING
🟢 Breadth: IMPROVING / BROADENING
⚪ Credit: HOLDING / IMPROVING
🔴 Top Risk: NONE
Stock Market State
The market has moved beyond last week's “structural continuation test” and into confirmed continuation.
Last week, the key question was whether the market could absorb higher oil prices, renewed inflation concerns, and geopolitical uncertainty without damaging the underlying uptrend.
This week, the market answered that question.
Oil reversed lower, volatility compressed, breadth improved, and equities reclaimed and held new highs. The market is no longer trading as a fragile rebound vulnerable to every headline. It is trading as a structurally intact uptrend that has successfully absorbed the shock.
Regime
Structural Uptrend Intact — Re-calibration Phase Resolved
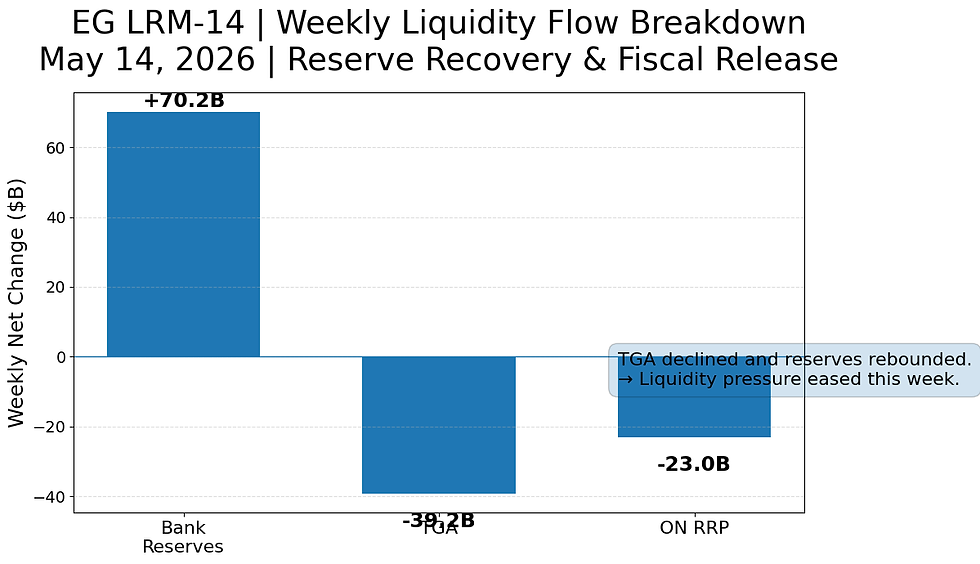
Liquidity regime remains Abundant, consistent with the latest EGLRM-14 framework.
The inflation impulse from the Middle East energy shock has not disappeared completely, but it is no longer intensifying. As a result, the prior dual-force environment has shifted:
Liquidity continues to support equities
Energy risk is no longer actively constraining multiple expansion
The market is beginning to reprice toward continuation rather than caution
The prior “under re-calibration stress” phase has therefore transitioned into a confirmed continuation regime.
Market Interpretation
This is now the new sequence:
Phase 1
Relief rally → positioning unwind → squeeze
Phase 2
Structural validation → volatility compression → breadth expansion
Phase 3 (current)
Confirmed continuation regime
The most important development is that the market no longer requires perfect news flow to continue higher.
During the last two weeks, the market absorbed:
Elevated oil prices
Geopolitical escalation headlines
Sticky inflation concerns
Higher-for-longer interest-rate fears
Yet structure held throughout.
That is normally not how a weak market behaves.
A weak market breaks when the narrative worsens. A strong market absorbs worsening narratives and continues higher once the shock fails to produce structural damage.
⚠️ This Week — Special Note
The EGTI Stock Market Trend Indicator system confirms that the prior temporary signal-adjustment period has fully resolved.
Execution remains active, with structure intact.
The continuation signal remains active and valid following last week's successful structural test.
The market is no longer in a daily-level pullback phase. It is now in a confirmed continuation phase, though short-term consolidation may still occur without altering the dominant structure. ★ ★
The continuation signal defines structure, not magnitude.
It may continue through follow-through strength, controlled consolidation, or sector rotation and does not require immediate vertical price expansion beyond current levels. ★ ★
EGTI Stock Market Weekly Trend Indicator functions as a mid-term structural trend indicator, not a precise turning-point signal.
After an EGTI signal is issued, the market often requires one to three weeks before the directional implications become fully visible in price. Short-term volatility, retests, or local weakness may still occur without invalidating the signal itself.
EGTB functions as a shorter-term leading signal within the same framework and likewise does not require immediate price confirmation.
Founder’s Note
The expected daily pullback never fully developed.
Daily structure continued to suggest consolidation risk, but price refused to break. Instead, the market resolved the reset through time, sector rotation, and internal rebalancing rather than through meaningful price damage.
That distinction matters.
For the last two months, the dominant story has not been money leaving the market. It has been money moving within the market.
Technology leadership paused, capital rotated into other groups, then returned. Each pullback was absorbed, not distributed.
Fig 1: QQQ Weekly Cash Flow Structure — Capital Rotating, Not Leaving
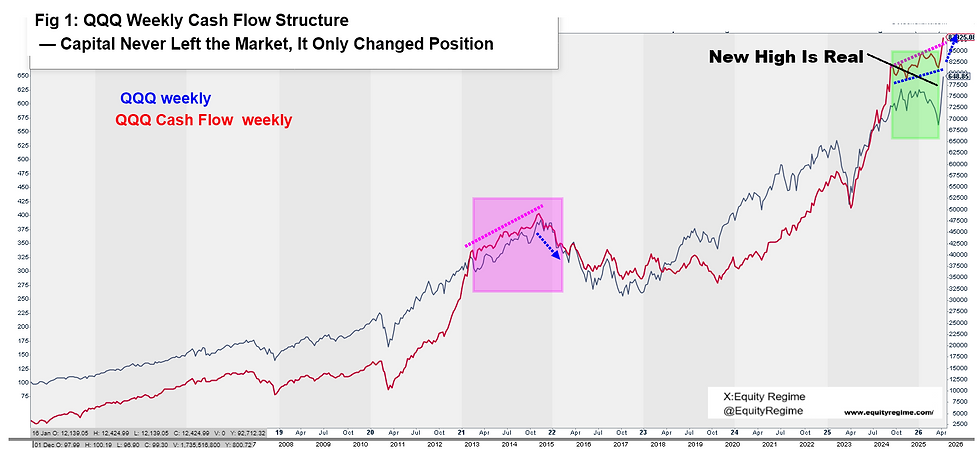
The last two weeks confirm that the prior pullback was not money leaving the market. It was money rotating within the market.
Capital temporarily moved away from prior leaders, consolidated, and then returned.
The strongest evidence is technology. Over the last two weeks, the largest-cap technology stocks have once again become the primary drivers of the advance.
That is not what happens in a weakening market.
Money never left. It simply changed position — and then returned to leadership at a higher level.
Fig 2: EG Positioning Risk Index — Positioning Still Below Historical Extremes

The current environment therefore resembles the transition from early expansion into mature expansion — not late-cycle exhaustion.
A late-cycle top normally requires extreme positioning, narrowing breadth, weakening cash flow, and an increasingly small number of stocks carrying the index.
We are not seeing that.
Instead, positioning remains below historical extremes, breadth continues to broaden, and cash flow remains constructive.
That is why daily weakness should continue to be interpreted as opportunity, not danger.
The key question is no longer whether to own the market.
The key question is where the next rotation will go.
As long as positioning remains below extreme levels, volatility continues to compress, and cash flow remains constructive, pullbacks are more likely to be buying opportunities than the beginning of a larger decline.
The other major shift is narrative.
Over the last several weeks, war and energy dominated price action. That influence is beginning to fade.
Energy prices may remain elevated and structurally unstable for longer. But that is increasingly becoming a sector-selection issue rather than an index-level threat.
The market is beginning to treat energy risk as background rather than as the primary driver.
The next phase is therefore likely to be driven less by geopolitics and more by earnings.
As the war narrative fades, earnings season will increasingly determine which sectors continue to lead and which merely participated in the rebound.
Verdict
Trend unchanged.
The first real structural test has now been completed successfully.
This is no longer merely a validation phase. It is now a confirmed continuation phase.
No reversal signal is present.
No extended re-calibration range is currently required.
As long as volatility remains compressed, credit remains stable, and breadth continues to improve, short-term pullbacks should continue to be interpreted as non-structural resets rather than evidence of a larger breakdown.
About Equity Regime
Equity Regime is an independent research platform dedicated to mapping structural shifts across markets, technology, and capital cycles.
Our focus is not on predicting daily price movements, but on identifying regime transitions — periods when consensus narratives lag underlying reality and long-term repricing quietly begins.
In an environment dominated by noise, our objective is simple:
Detect the shift before it becomes obvious.