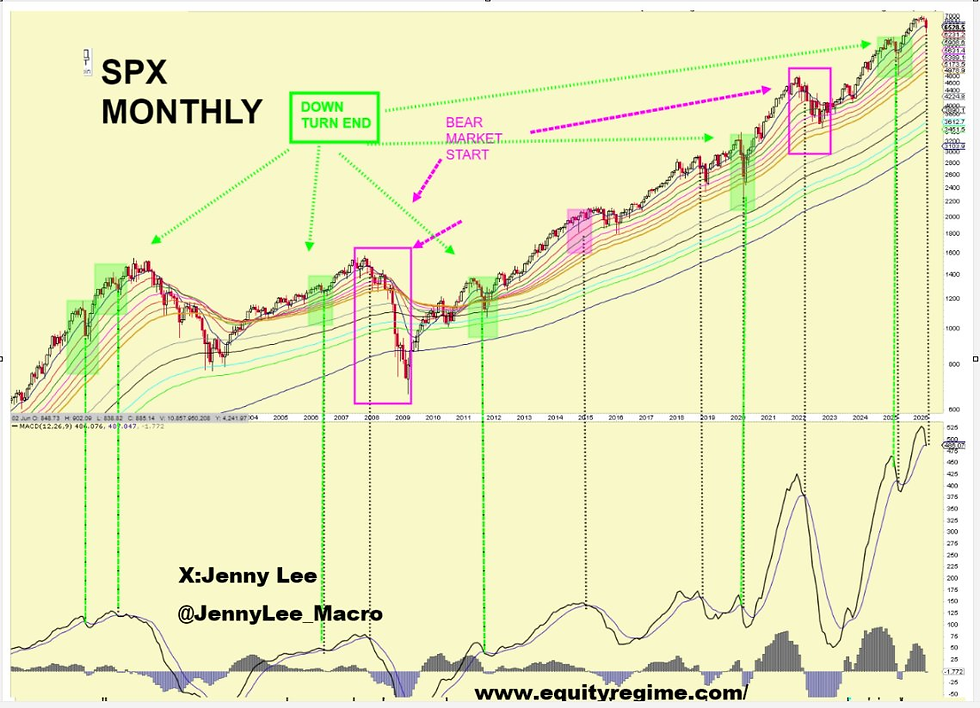
Technical Structure Comparison: Bear Flag vs Rising Channel

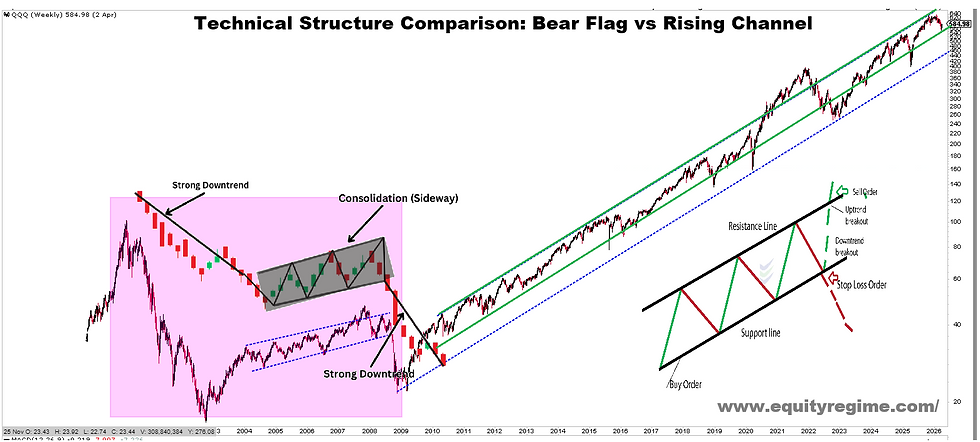
Bear Flag vs Rising Channel: Same Geometry, Different Structure
Technical patterns often look similar on the surface, but their function depends entirely on trend context.
This chart compares two commonly misunderstood structures:
1. Bear Flag (2000–2008 period)A bear flag forms within a primary downtrend.
It represents a temporary consolidation before continuation lower.
The upward or sideways movement reflects weakening counter-trend momentum.
2. Rising Channel (Post-2010 period)A rising channel forms within a primary uptrend.
It represents structured price movement supported by higher highs and higher lows.
Pullbacks inside the channel are part of trend continuation, not reversal signals.
While both structures may appear geometrically similar—parallel boundaries and consolidation phases—their technical implications are fundamentally different.
Key distinction:
Bear Flag = counter-trend consolidation → continuation lower
Rising Channel = trend-aligned structure → continuation higher (unless broken)
Confusing the two leads to systematic positioning errors, particularly when traders interpret strength as weakness.
Technical analysis is not about shape recognition.
It is about context and function.