EGTI Stock Market Weekly Trend Indicator Update 5/10/2026
- Jenny LEE
- May 10
- 3 min read


FIG 0 — EGTI Structural Market Regime Map
EGTI Stock Market Weekly Trend Indicator Update
5/10/2026
🟢 Regime: Structural Uptrend
🟢 Status: Continuation — ACTIVE
🟠 Condition: Expansion Resumption (Post Waiting Phase)
🔴 Risk Level: Moderate (Slope Expansion Monitoring)
EGTI Stock Market Weekly Trend Indicator Structure
The market structure remains unchanged.
What we are observing is not a new cycle, but a continuation and re-expansion of the existing structural trend.
Expansion → Pullback → Continuation
This sequence continues to define the post-2018 market regime.
The recent 3/22–3/28 phase should be interpreted as a Forced Waiting period, not a structural failure.
Price has since resumed trend expansion behavior.
Interpretation
No structural violation
Higher-low structure intact
Weekly trend continuation confirmed
No broad distribution expansion detected
This confirms that continuation remains the dominant structural state.
Short-term pullbacks or consolidation within an expanding weekly structure remain consistent with trend progression, not trend transition.
EGTI Stock Market Weekly Trend Indicator Model Note
EGTI is a trend-state model, not a timing signal.
Volatility and pullbacks inside this framework should be interpreted as part of structural expansion unless the weekly structure itself deteriorates.
Risk Layer
The system remains in a monitored expansion phase:
Slope acceleration at highs
Internal participation divergence
Leadership concentration monitoring
These conditions increase volatility sensitivity, but do not invalidate the current trend structure.
Invalidation
The current regime remains valid unless:
Weekly structure breaks
Higher-low sequence fails
Price loses structural expansion behavior
Until then:
This remains a continuation phase — not a transition.
Founder’s Note
This week’s core thesis is straightforward:
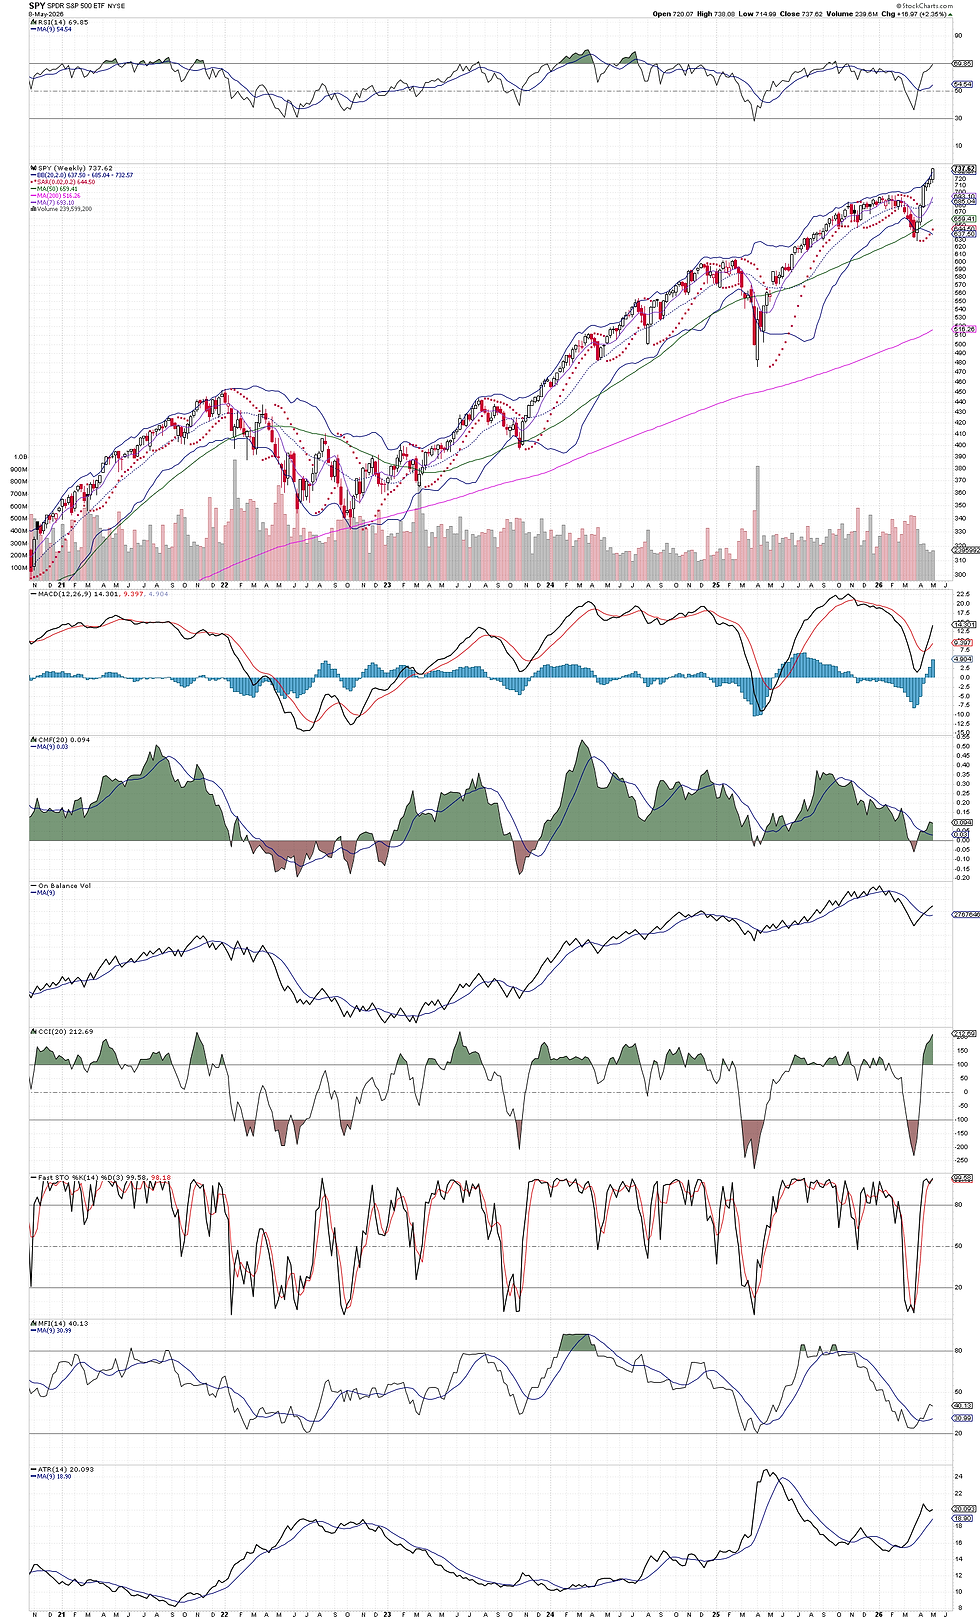
The broader $SPY structure has only recently entered a renewed trend-confirmation phase and may still have significant upside expansion ahead.
FIG 1 — SPY Weekly Trend Expansion Structure
At the same time, $SMH is beginning to display early-stage acceleration risk signals associated with overextended leadership behavior.
These two conditions are not contradictory.
The market does not require semiconductors to rise vertically forever in order for the broader uptrend to continue.
FIG 2 — SMH Accelerated Expansion vs. Terminal Top Debate

Recent comparisons between the current market and 1929 or 2000 have increased significantly, particularly surrounding the rapid expansion in semiconductors and the $SMH structure.
However, the broader market structure does not currently reflect a terminal top condition.
The weekly $SPY structure remains within an expanding uptrend regime:
Higher-low sequence intact
Weekly momentum re-accelerating
Weekly Bollinger expansion recently resumed
No confirmed broad distribution behavior
This distinction matters.
A market does not require every leading sector to move higher indefinitely in order for the broader trend to continue.
The collapse of the software bubble after 2000 severely damaged many growth stocks, yet the broader economy and market structure evolved through sector rotation and leadership transition rather than immediate systemic collapse.
The same possibility exists today.
Even if semiconductors eventually enter a cooling or consolidation phase, the broader market can continue advancing through:
software expansion
industrial AI infrastructure
power and electricity buildout
financial participation
broader market rotation
At the same time, the current acceleration in $SMH is not occurring in a vacuum.
The technical expansion is being reinforced by:
historically strong earnings growth
AI infrastructure demand
forward guidance confirmation
accelerating capital expenditure cycles
This is an important distinction from purely speculative blow-off structures.
Technical overextension alone does not automatically imply a structural top.
In strong expansion regimes, overbought conditions are frequently resolved through:
time consolidation
rotational pauses
shallow pullbacks
rather than immediate collapse.
At present, $SMH appears to be in an accelerated expansion phase — not a confirmed terminal structure.
That does not eliminate volatility risk.
It simply means:
the current evidence still supports continuation over transition.