EGTI Weekly Trend Indicator — Updated 03/12/2026
- Equality Regime
- Mar 12
- 4 min read

Market State
Volatility expansion within a preserved structural uptrend
Regime
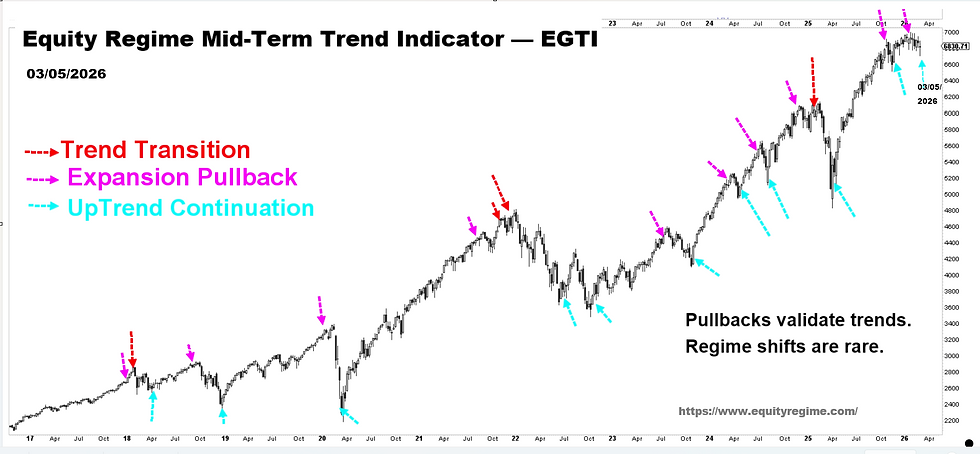
Structural uptrend intact (EGTI signal issued Mar 5, 2026)
Risk Structure
Event-driven volatility interacting with stable liquidity conditions
Verdict
Trend unchanged.
Markets are repricing geopolitical risk rather than transitioning into a new downside regime.
Indicator Framework
EGTI functions as a mid-term structural trend indicator, not a precise turning-point signal.
Short-term volatility or temporary price weakness may occur after a signal is issued. Historically, markets can experience one to three weeks of choppy price action or additional local lows before the directional implications of the signal become fully visible in price.
The signal issued in the previous update therefore remains valid unless the underlying structural conditions change.
Structural Conditions
Three core conditions continue to define the current market environment.
Liquidity
The EGLRM-14 liquidity framework indicates stable to slightly improving system liquidity. Bank reserves remain near the $3T level and fiscal flows continue to support financial system stability.
Credit
Credit markets remain orderly. There is no evidence of widening stress premiums or funding deterioration that typically accompanies systemic market declines.
Trend Structure
The EGTI mid-term trend structure remains intact. Current price behavior across major indices continues to evolve within consolidation ranges rather than displaying structural breakdown.
When liquidity is stable, credit conditions remain intact, and the structural trend is preserved, periods of heightened volatility generally reflect risk repricing rather than regime transition.
EGTB Daily Risk Structure
An EGTB daily bottom signal was triggered after the market close on March 9, indicating that the current phase of volatility expansion may be approaching the late stage of risk release.
Following such signals, markets often continue to experience elevated volatility and additional short-term fluctuations. The framework therefore continues to indicate that price action may gravitate toward the 200-day moving average as volatility expands.
Importantly, this behavior does not contradict the signal itself. Historically, EGTB signals frequently precede one to three weeks of choppy price action or secondary retests before a clearer directional stabilization emerges.
The signal therefore reflects the potential emergence of risk exhaustion dynamics, rather than the immediate formation of a price bottom.
Sentiment and Positioning
Investor sentiment deteriorated sharply during the week.
Bearish readings in the AAII survey rose significantly, while the NAAIM Exposure Index declined as active managers reduced equity exposure.
These movements reflect rapid sentiment adjustment rather than structural signals.
AAII surveys primarily capture emotional responses to volatility, while NAAIM positioning typically reflects tactical risk management during periods of uncertainty.
A key driver behind the shift in sentiment appears to be growing market concern that the Middle East conflict may persist longer than initially expected, increasing short-term geopolitical risk premiums.
Historically, similar sentiment deterioration has frequently occurred during consolidation phases within ongoing uptrends.
Capital Flow Dynamics
Geopolitical uncertainty has also influenced global capital allocation patterns.
Periods of conflict often trigger temporary reallocation of capital across regions. In the current environment, capital flows appear to be rotating toward the United States from parts of Europe, Japan, Korea, and the Middle East.
This dynamic has contributed to recent strength in the U.S. dollar index, which should not be attributed solely to inflation or monetary policy expectations. A portion of the dollar movement reflects temporary capital concentration within the U.S. financial system during geopolitical uncertainty.
Alternative liquidity-sensitive assets provide additional context. Bitcoin has remained structurally stable, suggesting that global liquidity conditions have not experienced the type of contraction typically associated with systemic financial stress.
Institutional Liquidity Signals
Dark-pool activity monitored through the DIX indicator provides important insight into institutional behavior.
Recent market weakness has occurred alongside rising DIX readings, indicating that institutional liquidity providers continue to absorb selling pressure through dark-pool transactions.
In systemic downturns, DIX typically declines as institutional distribution accelerates. The current configuration instead suggests that recent market volatility is driven primarily by short-term trading flows and hedging activity rather than institutional liquidation.
Volatility Structure
The VIX futures curve continues to show front-loaded volatility pricing, with near-term contracts elevated while the mid-curve remains relatively anchored.
This configuration indicates that markets are currently pricing short-term geopolitical uncertainty, not a sustained systemic volatility regime.
In genuine crisis environments, the volatility curve typically shifts into persistent backwardation across the entire term structure. That pattern has not developed.
Structural Interpretation
Taken together, the current configuration of indicators suggests that the market is undergoing risk repricing within a structurally intact advance.
Liquidity remains stable, credit conditions remain intact, and institutional liquidity absorption remains visible.
Under these conditions, the combination of:
• rising volatility• sharply deteriorating sentiment• declining positioning
is more consistent with risk-exhaustion dynamics developing within a consolidation phase than with the beginning of a new downside regime.
Structural Conclusion
Liquidity remains stable.
Credit conditions remain intact.
Institutional absorption remains active.
Recent volatility reflects geopolitical risk repricing rather than structural market deterioration.
Structural uptrend preserved.
About Equity Regime
Equity Regime is an independent research platform dedicated to mapping structural shifts across markets, technology, and capital cycles.
Our focus is not on predicting daily price movements, but on identifying regime transitions — periods when consensus narratives lag underlying reality and long-term repricing quietly begins.
In an environment dominated by noise, our objective is simple:
Detect the shift before it becomes obvious.