Stock Market Structure Continuation — EGTI Stock Market Weekly Trend Indicator Updated 04/12/2026
- Jenny LEE
- Apr 12
- 3 min read


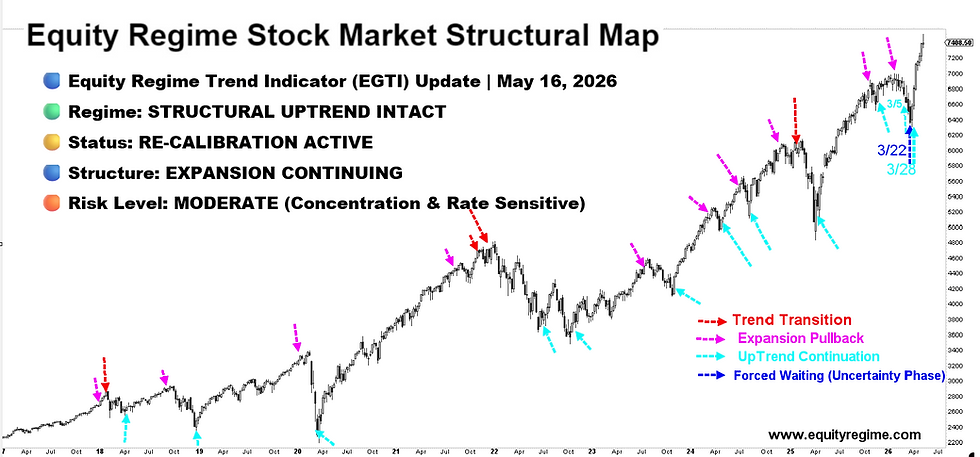
🔵 Stock Market Trend Indicator EGTI Signal Status
🔷 Trend: CONTINUATION — ACTIVE
🟡 Pullback: NON-STRUCTURAL (Daily Reset)
🟢 Structure: INTACT
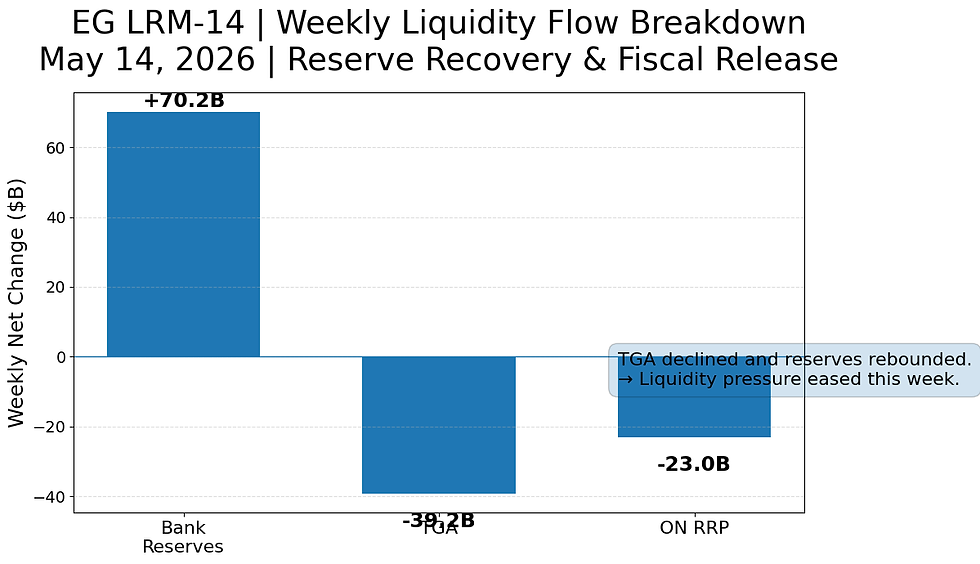
🔵 Liquidity: ABUNDANT (Re-calibration Active)
🔵 Stock Market State
Rebound phase transitioning into structural continuation test
The market is no longer reacting to the event itself (war / ceasefire headlines),it is now reacting to the persistence of the shock (energy + inflation transmission).
🔵 Regime
Structural Uptrend Intact — Under Re-calibration Stress
Liquidity regime remains Abundant (unchanged)
But inflation impulse (oil) is re-entering the system
This creates a dual-force environment:
Liquidity supports equities
Energy shock constrains multiple expansion
🔵 Regime
Structural Uptrend Intact — Under Re-calibration Stress
Liquidity regime remains Abundant — per our EGLRM-14 report released last Thursday after the close (see below tweet)
But inflation impulse (oil) is re-entering the system
This creates a dual-force environment:
Liquidity supports equities
Energy shock constrains multiple expansion
🔵 Market Interpretation
This is the key transition:
Phase 1 (last week):Relief rally → positioning unwind → squeeze
Phase 2 (now):Market must decide:
Absorb higher oil (→ continuation), or
Reprice inflation (→ pullback / digestion)
The failure of US–Iran talks and escalation risk→ removes the “temporary shock” assumption
🔵 Verdict
Trend unchanged.
But the market has entered its first real structural test.
This is not a reversal signal.
This is a validation phase:
If structure holds → confirms true continuation regime
If structure weakens → shifts into extended recalibration range
🔵 Stock Market Trend Indicator Framework
⚠️ This Week — Special Note
The EGTI Stock Market Trend Indicator system confirms that the trend continuation signal remains active and valid following last week’s structural confirmation.
The market is currently undergoing a controlled pullback phase at the daily level, which does not represent a degradation of the underlying trend structure.
Execution remains in place, with structure intact. ★ ★
The continuation signal defines structure, not magnitude. It may appear as follow-through strength or controlled consolidation and does not require immediate price expansion beyond current levels. ★ ★
EGTI functions as a mid-term structural trend indicator, not a precise turning-point signal. After an EGTI signal is issued, the market often requires one to three weeks before the directional implications become fully visible in price. This means short-term volatility, retests, or local weakness may still occur without invalidating the signal itself. EGTB functions as a shorter-term leading signal within the same framework and also does not require immediate price confirmation.
Founder’s Note
This pullback is not random.
It is technically structured and expected.
Price has retraced directly into the Fibonacci support cluster (38.2%–50%) on the weekly structure, while simultaneously interacting with the daily 200–50MA zone.
This alignment matters.
It tells you:
The move is measured, not impulsive
Selling pressure is being absorbed at predefined levels
Structure is responding to technical equilibrium, not breaking down
This is what a healthy trend does:
→ Expand→ Retrace into key levels→ Stabilize→ Continue
The prior highlighted phase shows the same sequence.
This is not a new condition — it is a repeat pattern at a higher level.
There is no structural violation here:
200MA remains intact
Retracement is contained within trend boundaries
No acceleration consistent with distribution
What you are seeing is not weakness.
It is controlled rebalancing within an ongoing trend.
The market is not searching for direction.
It is resetting positioning before the next move.
Fig 2: SPY Weekly Fibonacci Retracement into 38.2%–50% Support Zone

About Equity Regime
Equity Regime is an independent research platform dedicated to mapping structural shifts across markets, technology, and capital cycles.
Our focus is not on predicting daily price movements, but on identifying regime transitions — periods when consensus narratives lag underlying reality and long-term repricing quietly begins.
In an environment dominated by noise, our objective is simple:
Detect the shift before it becomes obvious.