US Stock Market Top & Bottom Timing Signals (EGTB)Signal Update | April 29, 2026
- Jenny LEE
- Apr 29
- 2 min read

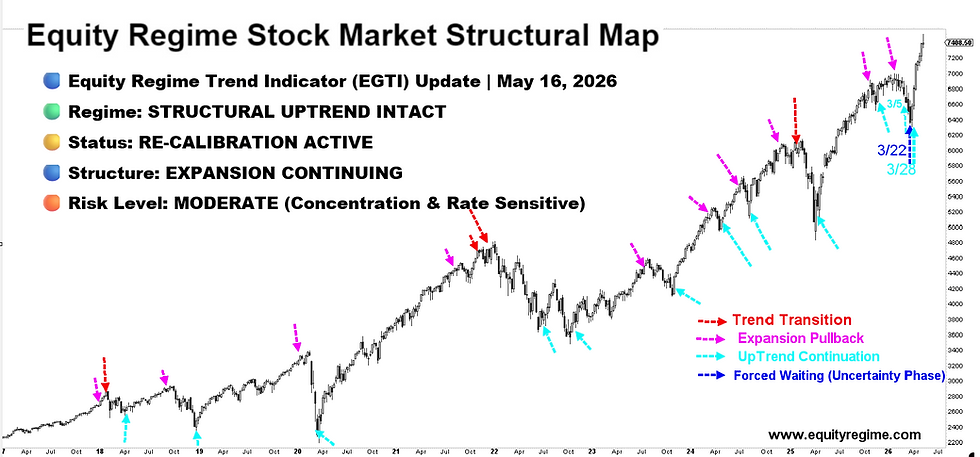
Fig 0 — EGTB Signal Map (US Equity Top & Bottom Timing)

🟢 Bottom: ACTIVE (Mar 9, 2026 — Carry-Over | High-Level Consolidation)
🔴 Top: NONE
🟡 Volatility: RE-PRICING (Orderly)
🔵 Structure: INTACT (Trend Holding, Index Consolidating)
🟣 Regime: DISPERSION (Earnings-Driven)
US Stock Market Top & Bottom Timing Signals (EGTB) Model Notes
US Stock Market Top & Bottom Timing Signals (EGTB) is a timing model, not a trend or valuation framework.
It should be used in conjunction with EGTI,
where EGTI defines the trend, and EGTB identifies the timing within that structure.
Bottom signals often unfold through volatility compression → consolidation → selective expansion.
A confirmed “Top” requires simultaneous alignment of:
Volatility expansion (persistent, not event-driven)
Positioning crowding (institutional + retail)
Credit deterioration
Absence of these = no top confirmation
Founder’s Note
This is not a topping process.
It is a high-level consolidation within an intact structure.
1. Positioning Has Reset — Not Reached Excess
Fig 1 :EG Positioning Risk Index

As shown in Fig 1 (EG Positioning Risk Index),positioning has moved from elevated levels back toward neutral.
There is no crowding, no excess, and no saturation of risk.
Tops require excess positioning —that condition is not present.
2. Broad Consolidation as Earnings Enter the Deep Phase
Fig 2 — Multi-Index Consolidation & Leadership Structure

As shown in Fig 2, consolidation is occurring across major indices:
$QQQ, $SPY, and $IWM are stabilizing at elevated levels
The index is pausing, not breaking
At the same time:
Leadership remains concentrated in technology
Broader participation has not fully expanded
$DIA has yet to confirm a breakout to new highs
Earnings season is now entering its deep phase, where outcomes begin to differentiate:
Index direction is no longer driven by liquidity alone —earnings are now determining both sector performance and index progression.
This is not a completed rotation —it is consolidation as earnings redefine leadership.
Final Read
Index consolidating at highs. Positioning reset.
Earnings driving dispersion — not excess, not a top.
About Equity Regime
Equity Regime is an independent research platform dedicated to mapping structural shifts across markets, technology, and capital cycles.
Our focus is not on predicting daily price movements, but on identifying regime transitions — periods when consensus narratives lag underlying reality and long-term repricing quietly begins.
In an environment dominated by noise, our objective is simple:
Detect the shift before it becomes obvious.